HRM’s Fiscal Power Rankings
West Bedford's rank may surprise you
by Matt Stickland
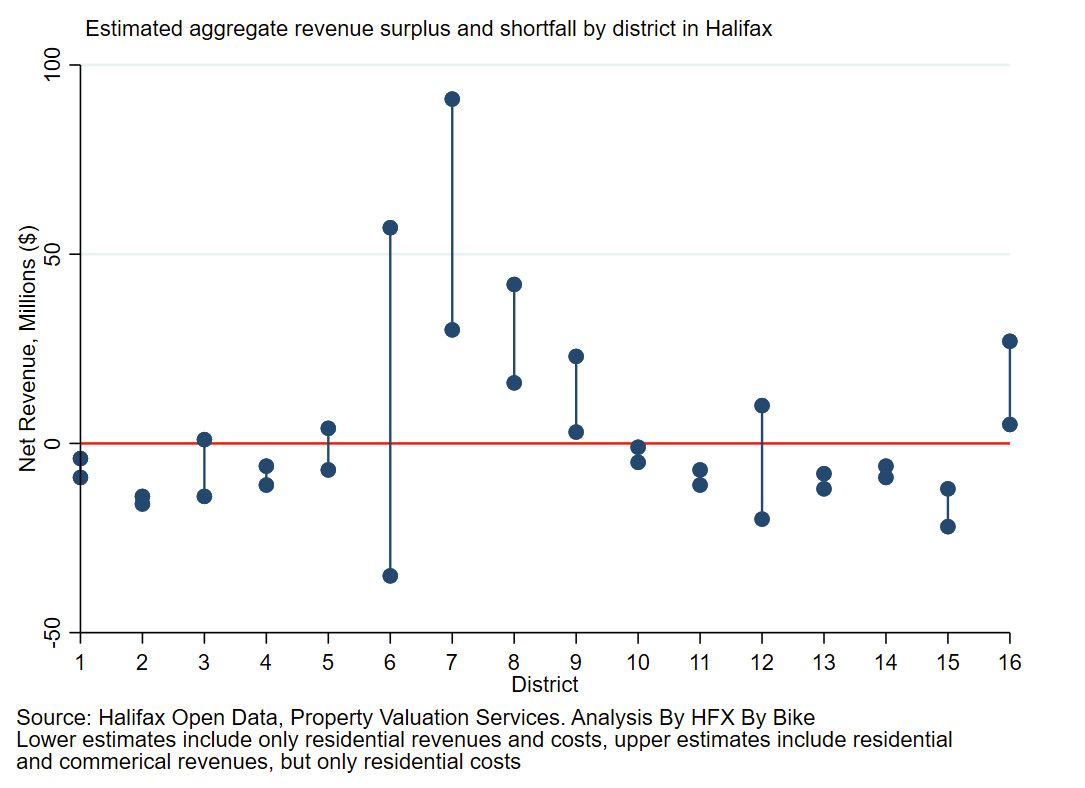
We’ve long known that Halifax is unsustainable. But now, thanks to some incredible work from local researcher Kevin Wilson, we have a much better idea of what those numbers are. Using Wilson’s compilation of the city’s public 2023/24 tax data, budget books and a 2005 HRM service costing report, we can piece together which districts are Halifax’s biggest money pits.
Rank 16, District 2, -$17 million/yr: The huge rural district with low residential and commercial density means high costs to service and low tax revenue, which puts District 2 in a $17 million hole every year.
Rank 15, District 15, -$15m/yr: Too much low-density residential, revenue from Lower Sackville’s productive (+$11m/yr!) commercial centers is not enough to prevent this district’s annual shortfall.
Rank 12, Districts 11, 13 & 14, -$6m/yr: Districts with low-density residential but high-value commercial all cost the city $6 million a year.
Rank 11, District 4, -$5m/yr: Suburban development and low-density commercial make Cole Harbour a perennial fiscal loser without the redeeming productive land use that rural communities have.
Rank 10, District 1, -$4m/yr: This rural district is ahead of rural peers and outperforms urban districts like Cole Harbour behind them because there are fewer residential properties to service, and Fall River and the airport bring in money.
Rank 9, District 12, -$2m/yr: The only district with higher residential costs than D12 is D6, and without D12’s $30m/yr in commercial tax revenue, this district would have cost the city $32 million in 23/24.
Rank 8, District 3, $0/yr: This is the only district to break even. Usually, laying an egg in a contest is a losing move but in fiscal power rankings, not being in the hole gets a mid-table performance.
Rank 7, District 10, $1m/yr: D10 starts us on the positive trend.
Rank 6, District 5, $3m/yr: Low-density residential on the outskirts drags down D5’s ranking.
Rank 5, District 16, $25m/yr: This is the first district where residential is also in the positive ($2M).
Rank 4, District 9, $28m/yr: It’s a $20m step up to third place.
Rank 3, District 8, $43m/yr
Rank 2, District 6, $58m/yr: Residential loses D6 -$34m/yr, so this is all Burnside.
Rank 1, District 7 $86m/yr: Congrats to District 7 and good luck to all districts in next year’s contest.
Power Ranking Methodology can be found here. This story is in Issue 30 of Grand Parade.